Sunday, November 26, 2017

Walls that invite others in: Transform your conversations about data

Last spring, I was invited to put together a 3.5 hour workshop for our state assessment conference that happens every December. I was told that the topic could be anything I wished. And, of course I agreed to do just that and hastily wrote a description in early June...and by the time my summer holiday started in July, I was already panicking. What the hell had I written? How was I going to deliver on this description?

Public narratives about schools often focus on measures of student performance. However, students are more than the sum of their test scores, demographics, and program participation. Join our conversation about how to repurpose and leverage data walls to create, inspire, and communicate with audiences about what matters most. As part of this interactive session, we will share examples of innovative data stories from both school and district levels, as well as tools and strategies for constructing new narratives about student and school outcomes.

Basically, I said I would facilitate some learning around how to build the sort of data (story) walls we've been doing recently. This sounds great on the surface. I truly believe that we have change the types of conversations we are having with and about data in education. In practicality, however, it turns out to be really challenging to develop guidance on how to listen critically for opportunities to transform these interactions...much less how to tap into and be confident about being creative with displays. As Isaac Asimov said, "The world in general disapproves of creativity...and to be creative in public is particularly bad."

I made a lot of notes this summer based around my own questions about using data, and this fall, I've been chipping away at organizing all my notes from the last 18 months into some sort of outline. Combined with the data academy work I'm guiding this fall, I have felt overwhelmed by the amount of adult learning I need to generate...all while trying to do my "regular" work.

https://twitter.com/science_goddess/status/930421496538841088
But, at long last, I think I'm ready for this workshop...which is a good thing, because it will happen on Wednesday. I don't have a lot of time left to fuss with it. It's time to fish or get off the pot, so to speak.

The slide deck is 150 slides (and 90 MB). I have around 10,000 words in my speaker notes. I've incorporated references to King Kong, Frankenstein, Pink Floyd, ETA Hoffman, and The Inferno. And, I've built a companion site on GitHub for all of the other links, references, handouts, and structure.

We'll see how this goes. Three and a half hours is a long time to spend with 40'ish people on one topic. The whole premise---building these oversized, experiential data installations---requires a different sort of investment and risk-taking on their part. I am not foolish enough to believe that they will all go back to their schools and districts and put up these displays. But let's say three of them do. What a wonderful start...and how I would love to know of others who are doing this work. It all has to start somewhere. I will plant seeds now and see what sprouts.

Monday, November 6, 2017

Five: On the Bubble

Student achievement data is among the most public data sets that exist for education. Scores from annual summative tests wind up in all sorts of places, from the front page of the newspaper to Zillow. Because of that, I've been shying away from using these data as the source of a data story. They already get enough attention, right?

But then I started hearing some conversations in my district that piqued my interest. (You can 
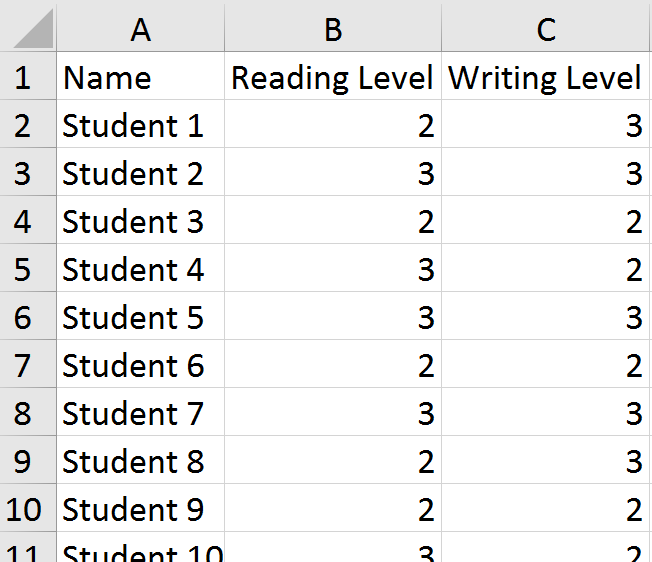
read about that on my other blog.) So I pulled scores for our current sixth grade students. I looked at their scale scores and performance levels from third, fourth, and fifth grade in the area of English language arts. I was interested in a few different things:
  • What is the average growth students made between grades 3 and 5?
  • What are the common characteristics of students who are persistently low-performing (or high-performing)? What about the ones in the middle (a/k/a "the bubble")?
  • What do we mean when we refer to groups of students as red kids or bubble kids?

The Data
Calculating the growth was easy: just subtract the 2015 score from the 2017 score. But understanding the significance of that change was a bit more challenging. Is it better to gain 75 points vs the 70 necessary to show two grade levels of growth? Probably, but how much better? I wasn't ready to just declare an arbitrary cut. I was going to need some stats to guide me.

Now, all you stats lovers out there can probably think of several ways to represent this (and maybe a few will leave comments to tell me how I can do it mo betta)...but in the end, I decided to do something very simple. I transformed the values representing the amount of change in scores to z-scores. I normalized them. Why? Because this gave me a quick idea of how many students had performance that was relatively typical to their peers (within one standard deviation) and which ones had even larger amounts of change (two or three deviations from the mean).

The Build
Once I had the various groups (-3, -2, -1, 1, 2, 3 SD), I thought more about how to represent this. But to back up a little bit, I have to say that my favourite starting idea was to cut different diameters of dowel rods into lengths that represented the amount of change for each students performance. Since we often talk about bubble kids, I wanted the data to look like bubbles. However, I don't have a saw that would make this simple work...and thinking about all the measurement involved and sorting things out made me a little queasy. I wanted a round shape, though. Lucky for me, Amazon sells bags of wooden disks in 1", 2", and 3" sizes. A-ha! Now I had something that corresponded to the calculated SDs and could easily paint them to match the level of student performance.

I still wanted to work in the concept of change. In other words, do students tend to stay at one particular level of academic performance? To represent this, I decided to stack the disks. If a student had spent only one out of the last three years at the most recent performance level, they got one disk. Two years at a level was shown by two, and three years with three disks.

Another challenge was to represent negative change. The raw difference between 2015 scores and 2017 scores ranged between -101 and +226. Although I could still place the disk on the display according to the 2017 score, I decided to paint the disks black to represent the "hole" in performance over time. Then, a roofing nail was attached to the back and the raw score written on the edge for placement reference.

The other materials for the build included five shades (orange, yellow, green, blue...and black) of shiny enamel paint in sample sized cans, wood glue and super glue, .75" roofing nails (leftover from the last story), fabric with small circles to reflect the bubble theme, and glittery grey paper for the lettering. My assistant and I punched 1" discs in the paper and used an enlarged dot matrix font to guide the creation of the letters. We slid the template for the words behind the fabric on the bulletin board, which was enough for us to see where to peel and stick each dot before sliding the template back out.

The "bubbles" were pushed into the board like oversized push pins, using the y-axis of the board as a guide for placing each disk in position (axis ranged from 2200 - 2800, with 2502 = met standard). There was no particular value assigned to the x-axis. We placed disks in that direction purely based on aesthetics of the overall display.


Lessons Learned
When I get an idea for one of these, it comes together very quickly. This one took a week from inception of idea to final product. And yes, that includes a lot of weekend time to pull, clean, organize, and transform the data. But I am always grateful to The Muse, when she deigns to visit, and willing to give in to the compulsion to create these works. I am also grateful to have an enthusiastic and supportive working environment for these. I try to keep them cost effective (the last two have included ~$100 in materials) and am always sure to keep up with my regular work while cranking out this other stuff.

These builds include a lot of trial and error. I am embarrassed to share how long it took us to figure out that we could just slide a patterned piece of paper behind the fabric on the board to use a template for the letters. We had googled for ideas for paper-to-fabric transfer. We plotted different ideas using a measuring stick and T-square. We drew things in PowerPoint. And then, duh, we figured it out. We did try different types of glue to see which was best for getting the non-pointy end of a nail to stick to wood. And so on. The lesson here is that even when you have to kill your darlings during the ideation phase, you can't give up during the build. Keep going.

To learn more about this data story, please visit the companion page for the analog build.

Wednesday, August 2, 2017

Four: The Class of 2018

This time around, we are not looking at one story, but 605 of them. This untidy display shows the pathway all of our incoming seniors are taking to graduation. Will we put a nice little bow on their K - 12 career...or will we leave them hanging this year?


The display is a Sankey diagram made of nails, mason line, foam board, ribbon, paper, and an untold number of swear words. Starting on the left side of the photo you see above, there are four blocks of colour, each one representing one of the high schools in our district. Each block is labeled with the name of the high school and the number of students/strands leading off to the right. The strands then weave through three different graduation requirements. First is passing the state math test, then the state English test, and finally being on track for earning at least 22 credits by the end of this year. Students who have met a particular requirement are grouped at the top...and those who have missed one or more requirements run along the bottom of the display.

I just put the story up on Tuesday, and already I've had a lot of questions and interest in it...more than any other story (so far). It is a bit of a mess, I realize, but so is the process of learning and making one's way through high school. And if you've tried to make 600+ individual strands behave, you'd probably agree that I've managed to do a pretty good job.

Inspiration
Honestly, I hadn't planned on this particular story. I've been thinking about one related to transportation for months...but my Muse wasn't having it. And then I got pissed off. You see, our state legislature and superintendent of public instruction worked out a deal to weaken graduation requirements...starting with those pesky tests that some students struggle to pass (along with the alternatives). But kids in our district don't finish high school mainly because of credit issues. Among last year's senior class, only 3 were in danger of not graduating because they hadn't met the state standards. I can't change the law, but I can call some attention to the facts.

I pulled the data for our incoming seniors and the numbers reflected what I'd noticed last year. More kids have met the math requirement than any other. We hear all the time how students struggle in math, but these kids are all right.

I wish I understood more about how my Muse works. I seem to go weeks (or even months) at a time where I can't quite capture magic in a bottle...and then I get the right idea and feel compelled to complete it. I did most of the work for this particular story while I was on vacation in late July. As I was putting this display up, I had more than one person ask where I get my ideas. I really don't know. I have a general area or purpose I want to explore...and I tag different displays that intrigue me on Twitter or elsewhere...but when it comes to how the analog/physical stories shake out, it's all just figuring it out as I go along. After the Muse makes a deposit, that is.

The Build
My dining table is five feet long, so I used it as a template for
the strands of mason line. I wound them around and then cut each end. From there, I tied two strands to 1.75" roofing nails. I chose these nails because they had a sizeable head to keep the line in place and because they were shiny. I wanted something that looked nice.

Next, I used a nail and some grid paper to punch the requisite number of holes for each school into foam board. After removing the paper, I used a hammer to place the nails in, ensuring that all the string was pulled in the same direction.

I used picture hangers on the back of each foam board that was at the top of a section and white ribbon to connect the various areas, such as the schools or the "yes/no" for meeting standards or credit requirements.

I grouped the strands for each school using the data...sorting the correct number of strands into each category. Then, I tied each group so that I could transport it easily to work.


Lessons Learned
These projects are exercises in solving one problem at a time. Some problems are related to the data. Others are engineering issues, for example, "How I am going to attach this to a bulletin board without incurring the wrath of the facilities administrator?"

As I've noted with previous stories, I have to let go of my tendency to want everything perfect. At some point, it's more important to just get something out into the world. I have a million other things I need to do (at least it feels that way), but also manage this compulsion to put out this particular data tale. I am very excited about two more ideas I have in the pipeline. My original goal was to produce ten of these. I have a ways to go, but I'm learning more with each one.

I still have to build the companion web page for this display, but can work on that over the weekend. I want to share some data related to which students are not being successful and are in danger of not graduating in June. This, plus what's on the bulletin board outside my office will make for good conversation starters as we gear up for the school year ahead.

Saturday, June 3, 2017

When Excel Is Your Hammer

Last week, a counterpart in a neighbouring school district sent me the picture you see at the right.

She'd been talking with a principal about their data and he'd been sketching what it was that he thought needed to have represented.The administrator wants to compare student performance on the reading strand of the state test with their performance on the writing strand of the same test. Although his drawing shows four levels of each, there are really only three reported: below, at/near, and above. Her question for me: Could this be done in Excel?

Um, sure...why not? We're just talking a scatterplot here. Replace the text of the labels with numbers (1, 2, 3) for reading and writing, then just get all up in that scatter chart's business. I sent my friend some basic ideas about how I would approach it, and said I would pull some sample data to model things.

I grabbed some information on 50 of my own students as a start. I replaced the levels reported for each student with numbers (above = 3, at/near = 2, below = 1). Then, I selected the columns with the numerical data and inserted a scatter chart. Easy-peasy, right?

Except, I forgot something important. Many students have the same scores. For example, on the left, we can see that students 3, 6, and 9 all scored in the "at/near" (2) range in both reading and writing. When we plot their points on the chart, they overlap and appear as a single point instead of three students. This was no good. Part of what the principal wanted to be able to see were hot spots---areas of the chart where the school would need to focus for next year. He also wanted to get information about individual students.

I should probably stop my story for a moment here and say that I do not think this---or any other---chart is necessary for the goals the principal stated. If you really just need a list of kids, put a filter on the columns and sort to find the students who are "below" in reading and writing. I suppose that if you really needed to get fancy, you could use a pivot table to summarize things. If you had to have a chart that gave you an idea of the size of the problem, a bubble chart might do. Or, possibly a heat map. I called my friend back and we talked about this. This issue is always the biggest challenge with translating someone's vision into practice. It also gets back to the question I am best known for in my district: What is the problem you are trying to solve? While my colleague agreed with me about the lack of general usefulness of the chart the principal had sketched, she still wanted to produce it. Maybe after looking at it, he'd have a better idea of what he was really after.

So, back to the drawing board for me. I know...I could have left her in the lurch ("Good luck!"), but I appreciate a challenge. Excel was not going to win this one, dammit.

It was then that I decided to jitter the data points. Jittering introduces a tiny bit of randomness to the values so that the points don't overlap so much.

I added two columns (C, E) for the jittered points. You can now see that students 3, 6, and 9 have values that are just a tiny bit different from one another.

The formula in C2 is =B2+(RAND()-0.5)/5. The purpose is to combine the original value with a randomly generated number. It uses the RAND function to create the random values. In this case, I didn't want a lot of noise added to the data, just enough to separate things on the chart. Once in place, the formula is copied down through the rest of Column C, and then applied in Column E to the writing data.

This is what the jittered plots look like, with a minor adjustment made to the axes. Now that I have a few values less than 1 and greater than 3, I needed to ensure those showed up on the chart. The new axis ranges are .5 - 3.5. After making that change, I deleted the labels and used text boxes to add back the original wording. For the data points, I assigned some transparency to the fill so we could better see the overlaps.

We now have a chart that reflects the principal's request. I sent off the file with the sample data and chart to my friend and hoped that it might spur some discussion with the administrator about whether or not this was the right tool for the job he had in mind. Just because we can use Excel doesn't mean we should.

https://twitter.com/fleurdevie/status/2810755338
I don't mean to discount the principal's intentions. Yes, a simple list of students would get you to the same place (and a lot more quickly). But it doesn't necessarily have the same impact as a visual. It may well be that the type of scatter plot shown above engenders some productive conversation with his staff. He has a story in mind that he needs to tell. In that case, maybe Excel is the right hammer for this particular nail.

Sunday, April 2, 2017

Backwards Bar Charts

Recently, someone shared a visualization from Periscopic about the Trump Emoto-coaster. While the subject matter itself was not of particular interest to me, I did like the presentation of it.

Strap yourselves in. Your hands must be this small to ride this ride.
The line chart at the top made me think about the rises and falls within a school year. March seems like an especially cruel month, with teachers' tempers growing short. (Just ask me about how I ended up in a conversation with a five-year old about why we need to wear pants at school.) How do attendance and discipline intertwine? And, when I looked at the horizontal bar cum sparkline plots shown above, it also made me wonder what we would see if we plotted individual classrooms over time. Maybe something like this:

Let's say there are four teachers at a particular grade level in a school. If we looked at the number of student absences and office referrals from the beginning of the year to the end of the year...what might we see?

If I was a principal, I might use something like this to either look for "hot spots" in my school that I might not know about...or monitor how well my school improvement initiatives are being implemented at the classroom level...or even to show staff for input. If I was a teacher, this might give me a general way to compare outcomes in my classroom. It might also piss me off (This just shows you that I have ALL of the bad kids!).

My challenge was how to build this. At its most basic level, this is a floating bar chart. And Ann Emery has a great tutorial for doing just that in Excel. But I didn't take that particular route this time because of how I need these charts to lay out. You see, absences for any given classroom total no more than 70 in a month...but referrals are no more than 13. Excel isn't going to let me push the edge of the chart off the lefthand side of the worksheet if I keep the x-axis the same on both sides, meaning I ended up with a ton of blank space. I suppose I could put attendance on the left and discipline on the right, but hey, what's Excel without some challenges?

So, how do you build a backwards bar chart?

Create your horizontal bar chart the usual way, then fuss a little bit with the axis settings.
Once you do this, then remove the gridlines and axes themselves, you'll be able to position this bar smackdab against the other one. You know it's worth it...you can work it. Just put that chart down, flip it, and reverse it.

Holla!
Another to know about this chart is the addition of the line down the middle. Since I deleted the gridlines and axes, I need some sort of visual between the bars. So, a simple line shape in grey 1.5 pt is all that was added.

In terms of labels, I'm going to leave them off. If you understand how one is laid out, then you can understand a whole school's worth. The numbers themselves aren't the big idea with this visual. It's the patterns and comparisons we're after. When we've identified those, we're ready to ask some deeper questions and dig into the numbers in a different way. These charts are the starting point for conversations...not the end...even if that seems a little backwards.

Tuesday, March 28, 2017

Make the connection: Student growth to teacher action

I have had the privilege of presenting at the ASCD annual conference over several years. I've been an ASCD member nearly my whole career. It's an organization that, as the rebranded conference name suggests, empowers educators in all roles to support students.

This year, I am presenting on the qualitative side of data. My session description is "If 'not everything that counts can be counted,' as Albert Einstein suggested, then how do we measure and represent student growth beyond test scores and grades? In this interactive session, you will learn strategies that capture student learning in multiple ways, as well as how to communicate feedback about the whole child using data visualization. Join the conversation about how to apply digital and analog tools to tell your students' stories and report the full spectrum of student learning."

The challenge of doing a presentation like this is that I have to submit the description more than six months before the conference. Whatever it is that I had in mind to talk about in August was long gone before I received notification that the proposal was accepted...let alone when I sat down to build the content. I am influenced, too, by all the things I have learned in the interim.

The basic story arc did finally emerge. I'll start first by talking a bit about why data visualization can be a powerful tool. This is my usual lead-in, and I think it helps to provide a few easy to grasp examples before launching into new territory. The next hook is to talk about achievement data. Now, this particular piece does not explicitly fit the session description, but my goal is to move from the larger scope of the purpose of data viz to what we typically see in education, and finally into non-traditional ways to represent education data...and perhaps even a little further than that.

I heard a presenter this morning say that "schools embrace business ideas as they are fading." In other words, what was hot in the private sector 5 or 10 years ago becomes the things that schools are talking about now. I have seen this happen a lot over the course of my career. And what worries me most now is that decisions about data privacy and access are being made now that will affect schools in ways they haven't even anticipated yet. I am not going to claim that I can change the world with my presentation and suddenly schools will make these conversations a priority...but it's a start.

My call to action for them is around being in control of creating their own narratives using data and to think about what they want to represent, not necessarily what they are told to represent. All too often, the public view of school data is just annual test scores. But children are so much more than the sum of their test scores. They deserve a more robust approach to sharing their stories (and to be involved in that process, as well).

I have an ancient (by web standards) wiki where I have placed materials for this session. Someday, I'll move everything over to GitHub...but for now, it's a reminder of the journey I've taken to this point and perhaps a place to shape the ideas ahead.

Sunday, March 26, 2017

ASCD 2017: Data Tools

This weekend, I am at ASCD's annual conference, now referred to as Empower. This is not the fourth year that I've attended (and presented...but more on that in another post), but it is the fourth time I've wandered through the exhibit hall with an eye toward what various companies are promoting to schools. The versions from 2013, 2014, and 2015 are available, if you'd like a trip down memory lane. In fact, that might not be a bad idea, because (Spoiler alert!) there was nothing particularly new or outstanding.

Data management and reports
There are no stand-alone systems here this year. Lots of vendors who focus on assessment and grading, however, do have displays and reports for managing student information. I asked the same question that I have asked for the last five years: Who builds your displays and reports? And yes, of course the developers make the magic happen behind the scenes, but there is still the same disturbing number of companies out there where that is the only answer. Or, there may be something along the lines of "we got feedback from teachers." This is all well and good---I support user involvement. I also know that developers and teachers are not data designers. People are spending a lot of time on these products, but they don't care enough to make the effort to ensure that effective communication with the data actually happens.

In one particular exchange, the project creator told me that all her charts were a result of her research. I have no doubt that the project is spawned from many years of hard work with teachers...but I know that she does no research with data design or communication. In fact, she was a little upset that anyone would ask about how she came to make her choices. I won't link to it here, but it's a new partnership with ASCD that you can look for, if you're interested.

Student assessment
There were some different displays this year for various flavours of student assessment. Scantron is making a big show this year. I chatted with them a bit and they have a few sessions this weekend. Perhaps I just hadn't noticed before that they are more than the "bubble sheet" company, but it looks like they're diversifying and growing into student assessment. I can't speak to the quality of this new content, but in an age of apps, google tools, and other options, it seems wise to be more than a company involved with scoring assessments.

Pacific Metrics is a content aggregators for various assessment banks, like the ACT or district-developed items. It produces no reports---it just integrates with existing school information systems. I think this is a desirable option for a lot of districts, especially smaller ones who may not have the resources to develop their own content. If someone else has valid and reliable items for you...and those can be automagically scored and then imported into your gradebook...it could be helpful. It's not a replacement for professional judgment---teachers would still need to ensure that the assessment matches the content.

The product I liked best came from Exemplars K - 12. This company provides not only rich tasks for the classroom, but also scoring tools and anchor papers. This last piece is incredibly valuable. These exemplars are representative of actual student work and can show teachers how to implement the rubrics. While I will always advocate for teachers to come together to develop tasks, score student work, and engage in conversations about student learning as a result, I can't deny that these banks would also support good teaching. I think this is especially important for rural or small districts, or schools with a high rate of turnover so that new teachers have a consistent framework in place.

Have you seen something this year for student data or assessment that you like?

Monday, March 13, 2017

Three: Student Information

In theory, I was going to publish one data story a month this year. In reality, it's March (the school year started in September) and I'm only on my third one. I am way behind on my goal. But I am learning to make my peace with that sad state of affairs. This project is going to run into the next school year...and I'm okay with that.

So let's talk about number three. It's a magic number, is it not?


This month(ish), we're looking at our various student information systems. Each collection of squares represents one system. On the left is Skyward, our district system...and data flows various directions from there to other systems, including TIDE on the right that we use for state assessments.

Each group has layers that are colour-coded by the type of accounts/users it houses. Green is for students, yellow is for teachers, pink is for school administrators, and little red pins are for district administrators. Only one system has blue, representing parents. The sizes of the squares tell you something about the number of people represented by the data set. Each square inch is 50 people. The green squares are largest and district administrators the smallest. All of the systems, excepts for one, include students.

Two of the systems that I chose to represent (SWIS and Google Apps) are connected to our system with a broken line, because there is not a direct data connection. Instead, a system of imports and exports is used.

I also built some charts to show a bit about how families are accessing Skyward. Generally speaking, they log in about twice a month, during the work week, and in the morning.

I don't have any specific data on how many users are represented by our state data warehouse (CEDARS) or GoogleApps. I can only tell you how many data points we transfer in a given week (~250K to CEDARS) or documents we share online (over 600K in Google).

Bottom line: There's a lot of data flowing around.

Questions to Ponder
I selected the topic of information systems because they really are invisible...yet their impact is very real. Me? I'm represented by those nearly invisible red pins in the center of almost every square. I can see all these data, but there are a lot of people who can't due to their permissions or system access. This data story project this year is about sharing data beyond the usual suspects like attendance or achievement. Information systems are a good place to shine some light.

In the end, this is really a story about power and privacy. You'd think that the biggest group in these systems (students) would have the greatest power to use these data, but the fact is simply that they have none at all. Some systems look large, like TIDE, and yet a student or teacher might log in only once or twice a year. Others, like Homeroom, look insignificant and yet they are our most powerful tools for reviewing student information. Looks are deceiving.

Bonus Round
While the offline bulletin board is intended to be a conversational piece, as well as a way to reach audiences that might not have an Internet connection, I always put together an online component, too. This time around, I share a video about the historical origins of personal privacy and provide a way for you to look at how the clicks you and others contribute to our web site add up.

Peekaboo...I see you.