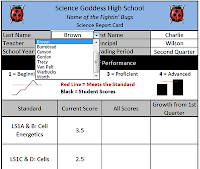
 Once you have your data all in their places with bright shiny faces in your spreadsheet, you're going to want to have a clean way to extract it. This is where a Dashboard is handy. A Dashboard is a type of reporting tool which pulls together different kinds of data.
In our model, we'll have space for a student's name, a rundown of current scores, an overview of total performance and a space to show progress/growth. There are other things you might want to report---such as attendance or qualitative information. Do what you need to do.
In order to get individual pieces of data from the sheet with the scores to the dashboard, you are going to need two things:
- A data validation list in a designated cell. I pick the cell beside "Last Name" for this. In creating this list, you will have a dropdown menu to select any student and the cell will become the "key" that will be used to extract the right data for the student and plug it into the empty spaces in the dashboard.
- A formula that uses both "INDEX" and "MATCH" functions. The INDEX function will tell Excel which column/table of data to draw from and MATCH will tell it which name the data goes with. Your formula will look like this: =INDEX(Column with Data for a Cell,MATCH(Cell on Dashboard with Last Name,Column with Last Names,0)) Why is there a zero at the end? It's part of the MATCH formula---it tells Excel that the match must be exact...no room for error.

Next time, we'll do the final piece: the sparkline graphs for the dashboard.

No comments:
Post a Comment