
I finally built and shared my first data story for the 2018 - 2019 school year. While I originally had some big plans for data stories this year — including community involvement — this has not turned out to be anything like a normal school year. I'll spare you the gory details, but just say that the impact of all the turmoil has been that I mostly don't feel interested in creating anything...even though my passion for this project remains. So, over the last three months, I have been chipping away at doing something and hoping that this will rekindle some joy.
Background
I have been wanting to look at our intervention data. In our state, supplemental funding is provided via the Learning Assistance Program (LAP). The goal is to work with students who are at least one grade level behind in reading or math and accelerate their learning so they can meet grade level expectations. Our district uses nearly all this funding in our elementary schools to buy teacher and paraeducator time. These interventionist use a "pull out" model where students come to a separate space each day for up to 30 minutes of extra instruction, tutoring, and support. Each school determines which grade levels to serve, which area (reading or math), how to group students, and what materials to use. There are a lot of variables, but the bottom line is really about outcomes.
What I've noticed over the last several years is that once a student is identified for LAP services, they rarely make enough progress to exit the program. The primary reason why they leave the program is that it's the end of the school year and there's no more time. However, the news isn't all bad, but it's still challenging to identify what it means for the program to be effective.
The Data
For this story, I pulled student performance data from fall and winter for every K - 5 student who has been served in LAP this year. I wanted to look at both growth and proficiency across schools. I also wanted to show some of the difference in the populations we serve — for example, a student with low-performance might receive support at one school, but not another, just because of program capacity and the volume of students to serve.
After I pulled assessment data for each of these students, I found the raw difference between the number of points earned between fall and winter. I compared that with the amount of growth necessary to maintain an "at grade level" performance between those two time points and identified each of the LAP students as having less than or at least that amount of growth.

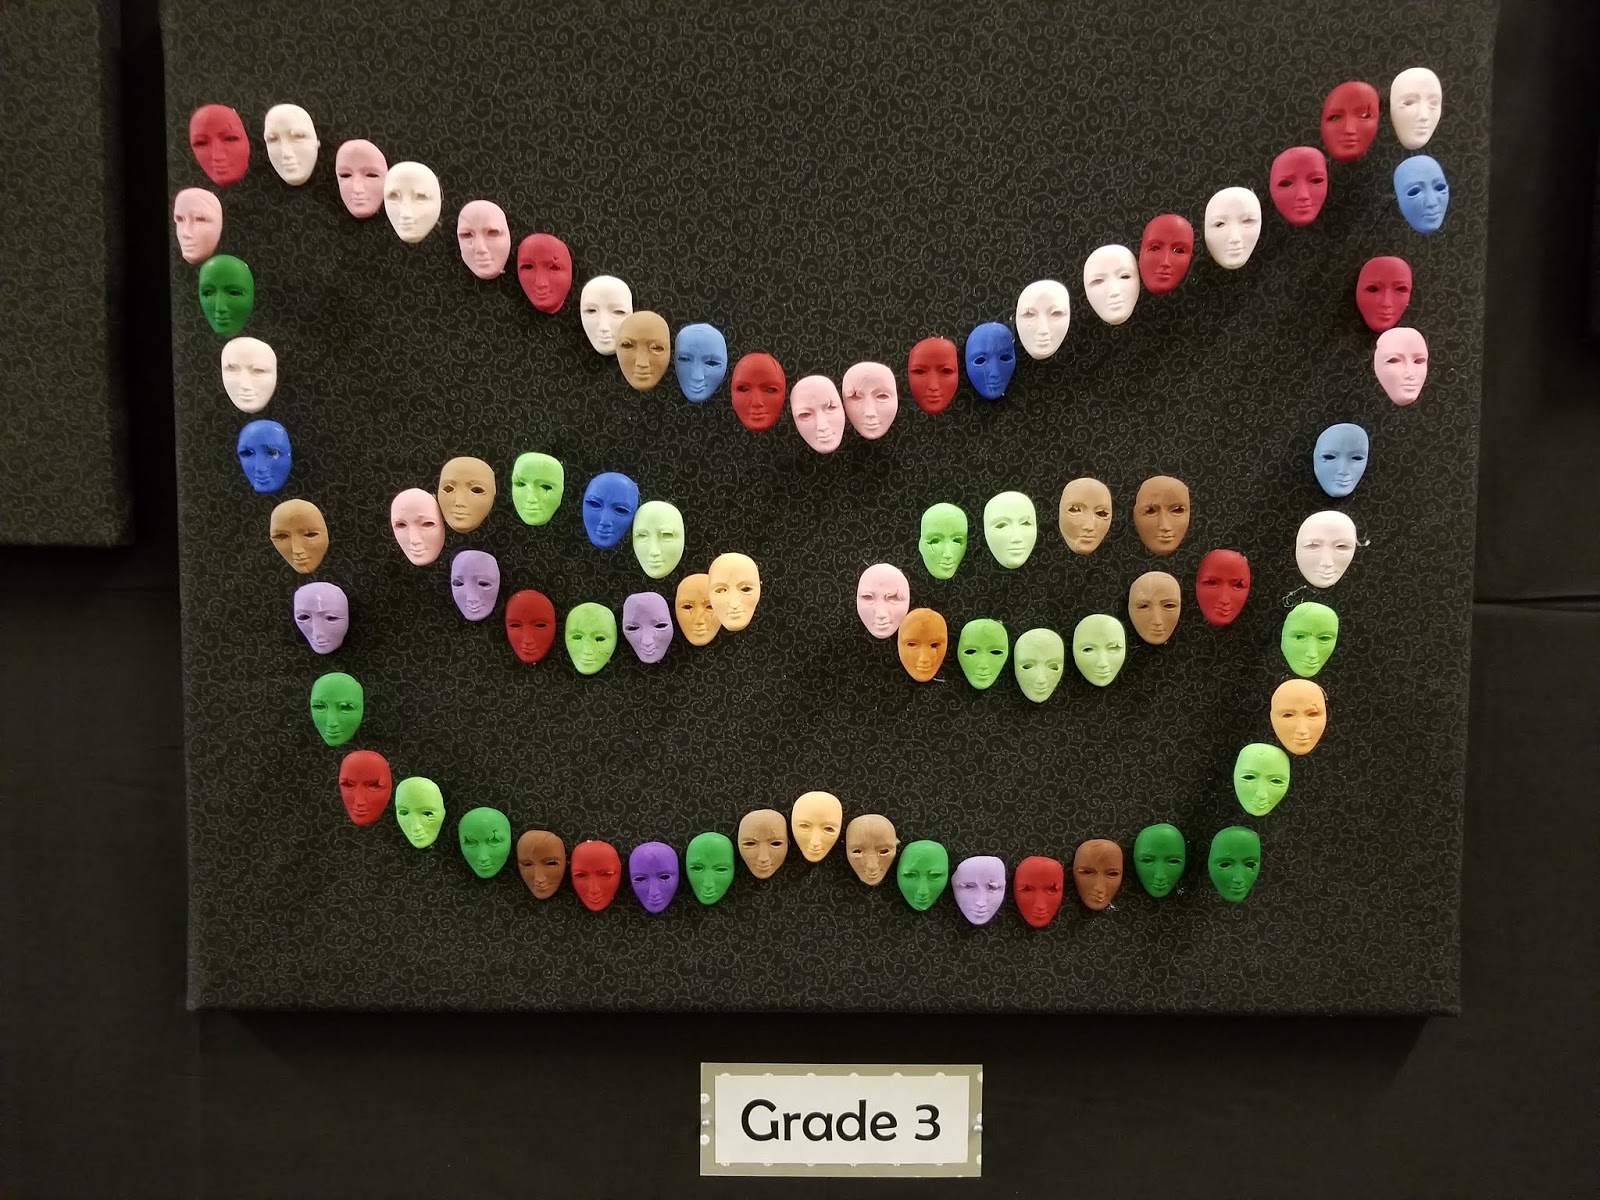
I used Sculpey clay and a mold to create a face for each student. We have six elementary schools, so six colours (orange, blue, purple, red, green, brown) were used. The clay was tinted to create a gradation of each colour to represent the number of years the student had spent in the intervention program. More years equaled a darker hue. Faces representing students who had made more than the required amount of grade level growth were attached to a pin so they would stick out from the board, creating a 3D effect.
I used six boards, one for each grade level. Students were placed on the board based on how much overall growth they had made between fall and winter. This was not an exact placement—I used a bit of artistic license to group students. My goal was to create a mask shape with the faces, with the idea that we were trying to reveal something about the program.

Lessons Learned
I have to admit that this was not my favourite project to do. It was important from the standpoint that I needed to get back into producing stories again and this forced me to at least think about communicating with data. However, it did reveal some things about our intervention program, including that it's not particularly effective. Considering the state gives us nearly 2 million dollars to run it, I'm not convinced it's a good investment of taxpayer dollars. This is not to say that students don't grow or that for some individuals it provides good support. It doesn't mean that there aren't some adults in our buildings busting their rears to make a difference for students. But if the goal is to get every child to be able to perform at grade level for reading...well, there's not a lot of good news in this story. When I think about the students who have spent multiple years in the program, I wonder why we keep exposing them to the same intervention and expecting a different outcome. What should we be doing instead? We still haven't had that conversation in our district and honestly, I don't know if anyone is interested in doing that.
No comments:
Post a Comment